Take a look inside 5 images
FooPlot
Pros: Kids can make a variety of graphs without an expensive graphing calculator.
Cons: It needs way more support in terms of tutorials and sample lesson plans.
Bottom Line: It's free, it's simple, and it does the job; you can plot functions, polar equations, parametrics, and points.
Teachers will love that all of the saved plots are considered public domain; they can be used to create worksheets, presentations, or assessments without copyright concerns. Teachers can also use FooPlot to provide inquiry opportunities for kids. Prior to learning about how a particular function looks and responds, give kids a chance to manipulate it using the Fooplot tools. Kids will be able to figure out for themselves how changing a function changes the graph. Give them prompts like, “What happens to the shape of the graph when you plot an even exponent as compared to an odd exponent?”
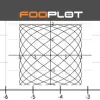
FooPlot is a free online tool that lets kids plot functions, polar equations, parametric equations, and points. It's pretty simple to use; you can layer different graphs on top of each other, and a tool bar lets you find intersection points and roots. Other tools let students trace points on a graph, move it, and zoom in or out.
Once a plot is created, it can be exported as a PDF or other various file formats for later review. FooPlot could be used in middle and high school math classes ranging from pre-algebra to pre-calculus.
One of the best things about FooPlot: It allows kids to quickly see multiple representations of the same mathematical idea. They immediately see that if they change the equation, the plot changes too. There certainly aren't any of the bells and whistles featured in tools like Desmos or ExploreLearning Gizmos, but it's a serviceable tool that can be used in lieu of a graphing calculator. Most of the tools are easy to use, with the exception of the Zoom Box button, which doesn’t respond consistently.
As with any tool, there are limitations. FooPlot only finds the roots or intersections for some functions; it won't find them for polar plot types. Since FooPlot uses Newton’s method, it won't be able to find roots for certain functions, like those that exhibit fractal behavior or those you can’t differentiate.


