Take a look inside 5 images
EarthViewer
Pros: Extensive data is visual, accessible, and downloadable, and can be used in all Earth Science subjects and projects.
Cons: Requires context and a larger lesson or project to be at its most useful; would benefit from a full curriculum or set of lesson plans.
Bottom Line: An unbeatable Earth Science app for its data, scope, and potential for learning.
EarthViewer is a valuable informational and visual tool for use by both teachers and students to access Earth's deep history and data. Teachers may want to start by reading the app's Quick Start Guide covering how to use the app in the classroom, or by visiting the publisher's website, which contains a few lesson plans and classroom activities. EarthViewer can be used with any lesson that deals with Earth Science or the history of Earth itself, from plate tectonics to our atmosphere's development to climate change.
Some other ideas for its use include:
- Follow a chosen location back in time to see how the continents shifted and see where, for example, New York City was located millions or billions of years ago. This can also be done with well-known fossils' locations over time.
- Have students research climate change to track planet temperatures over recent decades, and to see how carbon dioxide quantities changed over millions of years.
- Track biodiversity levels and match them with mass extinctions, plotting our larger history over millions of years; this can be correlated with other data in the app.
- Download the raw data used to create the charts in EarthViewer for use in more in-depth research projects. This data includes millions of years of numbers for carbon dioxide concentrations, temperature, fossils, mass extinctions, biodiversity, and more. Students can interpret this data on their own to draw conclusions, or teachers can use it in their lessons.
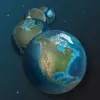
EarthViewer is a hands-on data model of planet Earth through its whole history, allowing students and teachers to travel back and forth through time, studying modern history, the last eon, or back 4.5 billion years to the formation of the planet. It's available as an app, as a Windows or Mac download, or for use in your browser. Manipulating the app's controls allows users to see how the continents were oriented millions of years ago and how they moved into their positions today. It also lets students compare such data as the temperature of the Earth and the carbon dioxide levels in the atmosphere over billions of years.
The interface includes timeline columns on the left that show the eon, era, and period, as well as a movable marker showing the current displayed point in Earth's history. Users can tap to get more information, as well as pinch in or out to switch between the three timeline views. On the right side of the screen, Earth can be rotated, moved around, or zoomed in or out. It's also where users can see information such as how far in the past they are looking, how much oxygen and carbon dioxide were in the atmosphere, and how long the days were. At the bottom of the screen are many additional options: Charts can be displayed showing temperature, oxygen level, carbon dioxide level, day length, luminosity, and biodiversity over time. Users can also toggle markers on the map and timeline for geological events, biological events, mass extinctions, impact events, fossils, cities, and the latitude and longitude grid.
EarthViewer is based on the latest scientific research and has a great deal of potential for use with many Earth Science-based lessons and activities. It covers a great deal of time (all of Earth's history), but doesn't go into too much depth on the concepts and subjects it addresses. It focuses on representing the data visually, making it available for others to draw conclusions and pursue further research; it's a perfect free tool to have in your toolbox for bringing a visual element to lessons. That being said, teachers and students could get more out of this app with additional lesson plans, curricula, or tips for use, either linked to in the app or in a central location on the website. Perhaps even a series of quests could be created, giving students a goal as they play the app.
One thing that's fairly notable in a free app, however, is that the raw data used to create these models and graphs is all easily downloadable from the publisher's website. This allows teachers and students to delve into the real numbers behind the app, draw their own conclusions, and use them in their own research projects. On its own, EarthViewer is an interesting resource, but some careful consideration is necessary to use it to its fullest: making powerful points and engaging students in meaningful discussion.


